There are a lot of opinions out there considering what’s acceptable for low frequency amplifier performance. It seems like everyone has their own very strong opinion about how low the frequency response must go for an amp to be “acceptable”. And it seems that usually these opinions range from somewhere between 40Hz and 20Hz as the minimum acceptable “roll off” frequency with definitions of “roll off” ranging from “no loss”, to “-1dB”, to the Engineering standard of -3dB. And strangely enough, virtually no one ever addresses the technical performance of amplifiers at their low end rolloff frequency. Amplifier distortion is usually only measured (when mentioned at all) at 1kHz and not across the frequency band.
Now the really interesting thing is the number of audio transformers built and sold with minimum frequency specifications from 40Hz (like the Edcor GXSE series) all the way up to 100Hz (like the Hammond 125_SE series). If low frequency amplifier performance really needs to go down to at least 40Hz (and preferably much lower), how could these companies sell these transformers? And if these transformers keep selling year after year (which apparently seems to be the case), either most amplifier builders and customers are really poor judges of audio quality or many of those “very strong” opinions are based more on internet bravado than facts and experience. But how do we know?
I decided that it would be a good idea to take a hard look at how one of these transformers performs in one of my recent builds. The project I chose was my 6CY7 amplifier I recently completed and posted on my web page.
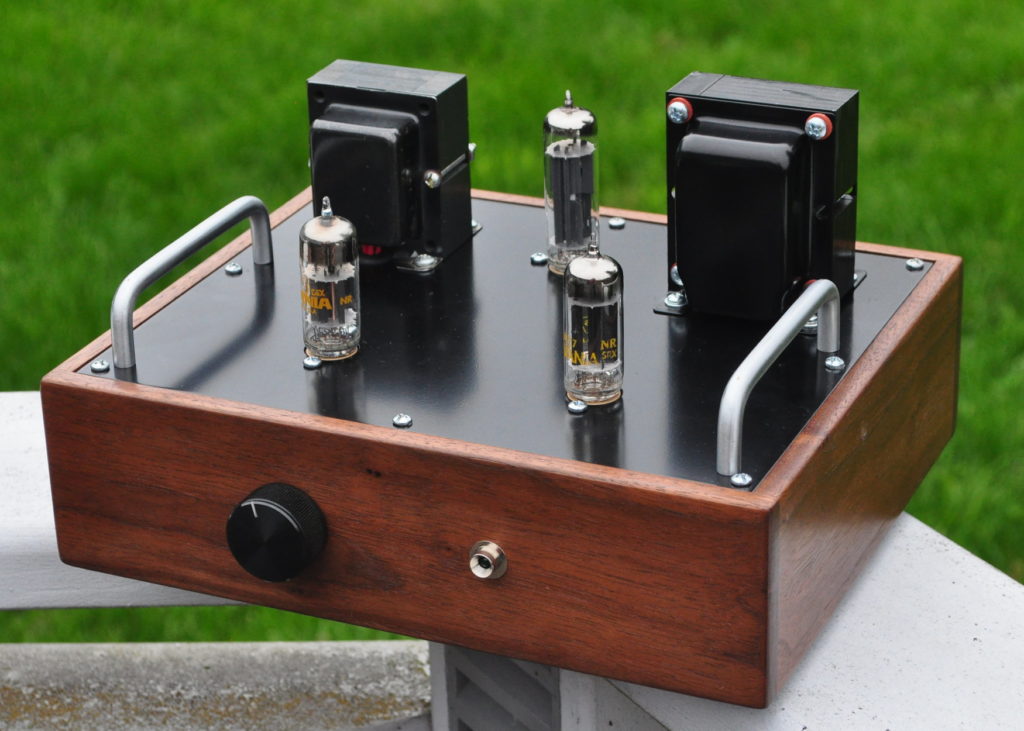
Before I relate any of the technical details, I will tell you about the subjective performance of the amplifier. The amp has one of the best sounds I have ever heard in a vacuum tube amplifier. It is clean, detailed, and very easy to which to listen. The lows are clear, strong and very true to life. And these are not just my assessments. Others I have had listen to the amp I’ve built share my assessments. Also, those who have built this design based on my posts on the internet have told me how much they appreciate the fine, clear, and realistic tonal quality of this amplifier design. I have received no comment about weak bass performance or restricted frequency range from anyone who has actually built the amplifier.
Now for some technical details. The amplifier is a Single Ended Triode (SET) design using the 6CY7 dual triode. Both the driver and power stages are cathode biased; the power stage having a bypassed cathode. The power supply is a split design using three chokes (one primary and one secondary for each channel) with isolation between the two channels and between driver and power stages in each channel. The output transformer used is the Edcor XSE10-8-5K single ended open frame model. Edcor lists this transformer as having a frequency range of 70Hz to 18kHz (<1dB).
There are some who have told me (a few rather forcefully) that this amplifier can’t sound as good as I and others say, simply due to the output transformer. So let’s take a look at the technical performance of this amplifier and see whether the technical measurement supports the subjective reports of its audio quality. Naturally, I took the amplifier back to my workstation to run it through some testing.
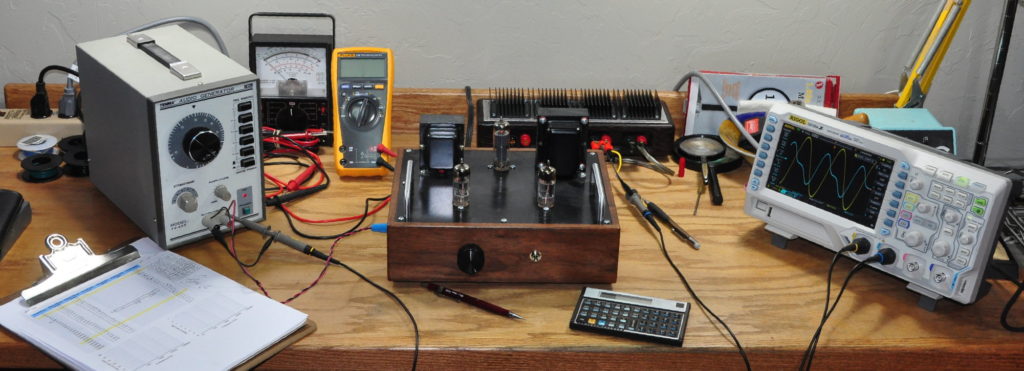
I am going to start with the bandpass characteristic of the amplifier. This was taken across frequencies from 10Hz to 100kHz at a midband output power of about 790mW or -1dBW. Input was a single frequency sine wave of 1.00 V-peak. This is nowhere near the 10W rating of this transformer but I thought it was a good representative number for normal listening. The DC bias current through the transformer in this design is approximately 29mA. Here’s the result.
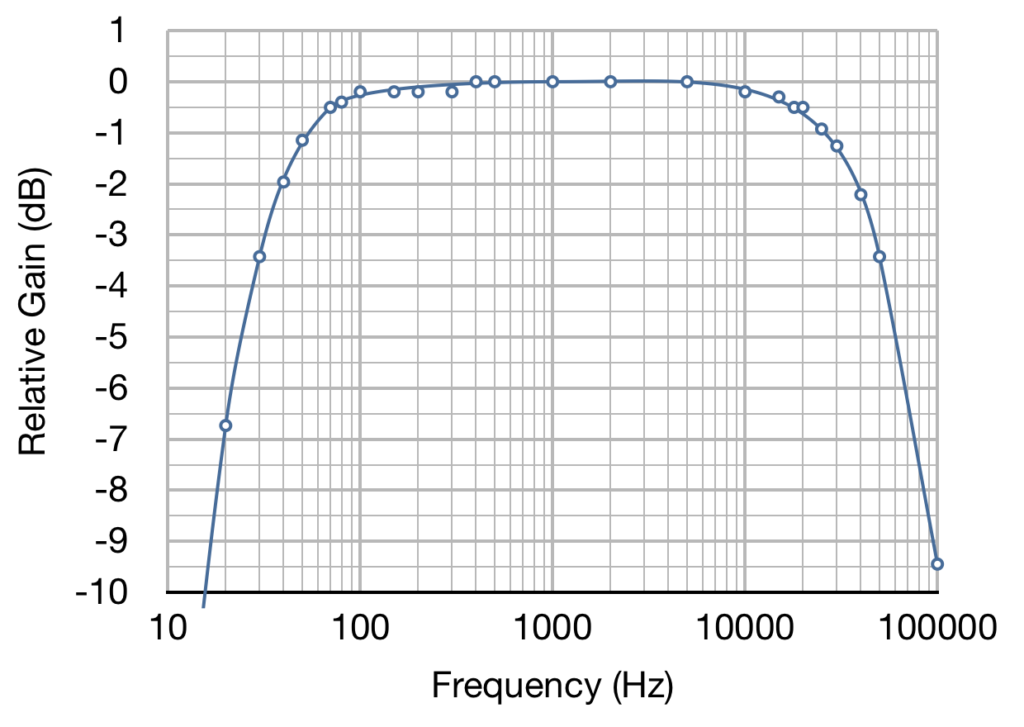
This plot shows some interesting things. First, the amplifier actually exceeds the published transformer specifications. At 70Hz and at 18kHz the response curve is only 0.5dB down from maximum midband gain. The amplifier actually meets the <1dB specification from ≈53Hz all the way up to ≈25kHz. Obviously, a hearty well done and thank you is in order to the design and build teams at Edcor. Delving into the low frequency performance even further shows that the response is only down by 2dB at 40Hz, 3.4dB at 30 Hz, and 6.7dB at 20Hz. Given the normal variation in low frequency hearing sensitivity across the population, these numbers can hardly be considered unacceptable low frequency response.
It should also be noted that the circuit design of the amplifier sets the interstage low frequency -3dB point at 15Hz. This was done intentionally to rolloff the drive at low frequency to help avoid any undesirable core saturation or hysteresis effects. This means that of the 6.7dB loss at 20Hz, about 2.4dB belongs to the interstage coupling. So the transformer rolloff is more like ≈4.3dB at 20Hz. This isn’t bad at all for a transformer marketed and sold as a 70Hz unit.
Now we know that the transformer is passing the low frequencies rather well. This certainly supports the subjective assessments of the amplifier’s performance. But like most things, this really isn’t the whole story. Some people like to think of a transformer as just a couple of big inductors, but in reality it is much more. An output transformer is actually three distinct carefully designed circuits. There is a primary electrical circuit to drive the transformer, a coupling magnetic circuit in the core to transfer energy, and a secondary electrical circuit to provide power to the speaker. All three must be carefully designed to ensure that the transformer behaves as desired. One of these circuits tends to be the limiting factor as frequency decreases. Typically, it’s the performance of magnetic core that breaks down as frequency decreases. So let’s investigate.
Here are three pictures showing the results of a single frequency sine wave input at progressively lower frequencies. First is the waveform at the stated minimum transformer frequency, 70Hz.
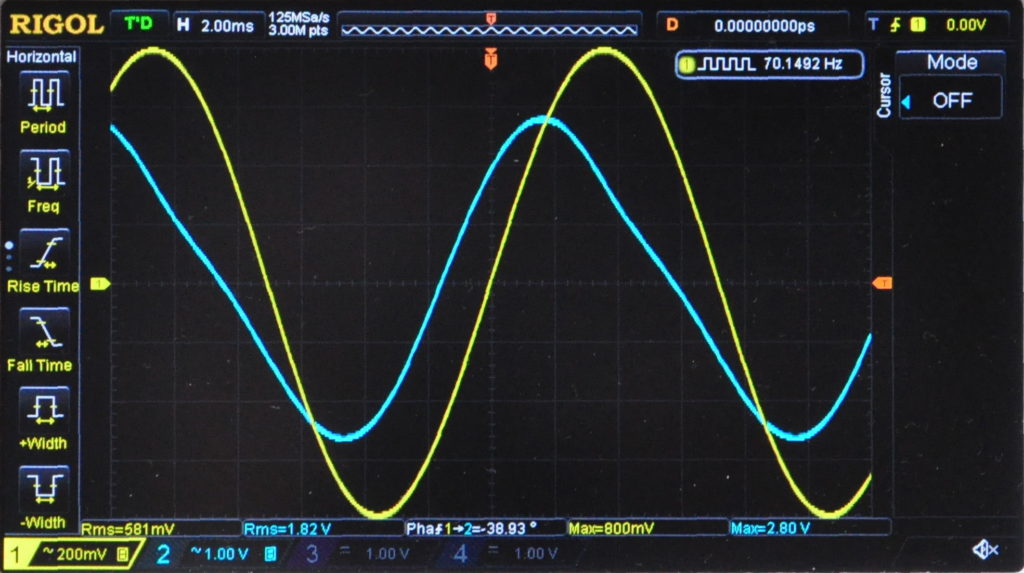
The input waveform is in yellow and the output is in blue. The output shows some small deviation from a sinusoid but it doesn’t really look too bad. The next picture is the waveform at 40Hz.
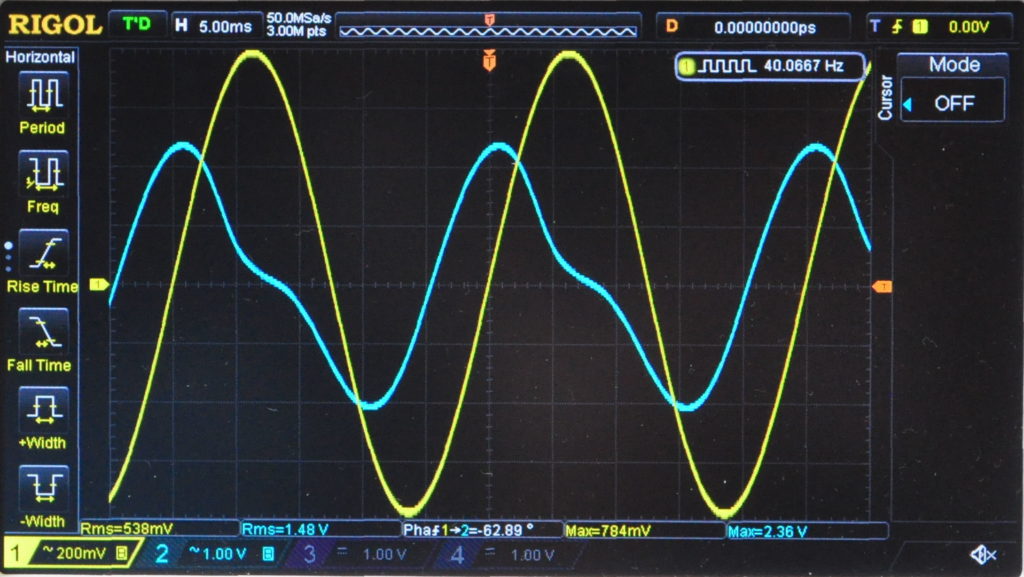
This waveform clearly shows some problems on the trailing edge. It appears that there is insufficient magnetic energy stored in the core to maintain the waveform on the trailing edge at this low frequency. This is generally due to the cross sectional area of the core not being large enough to support these frequencies. Looking at the waveform at 20Hz further illustrates the distortion.
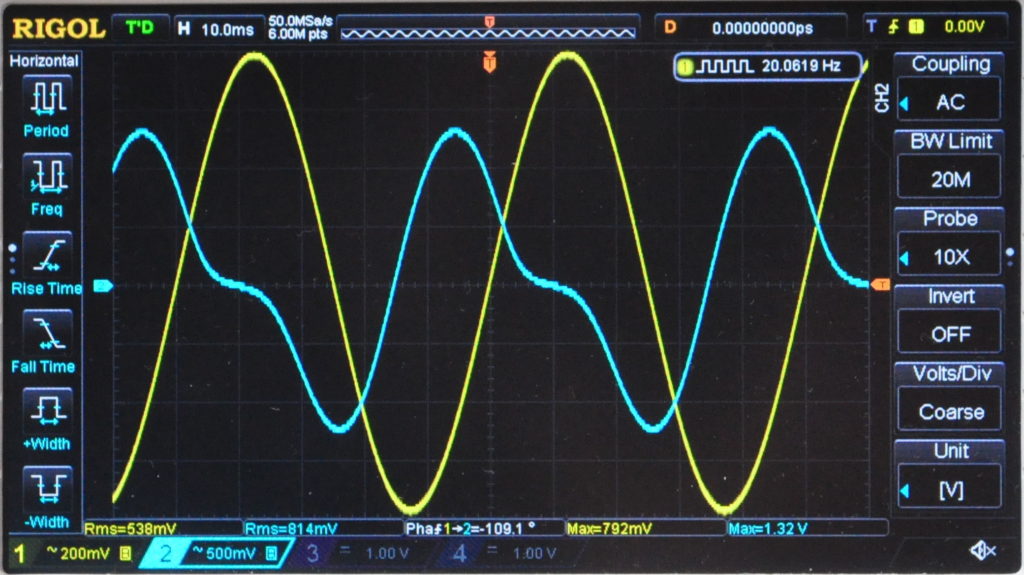
Now, before we begin making assumptions about how this might sound, we need to see what this really means to the waveforms themselves. It is important to remember that these are only the low frequencies showing this distortion. Given the typical harmonic content of musical notes (i.e. rich in harmonics) only the lowest of these notes and harmonics will be affected. So lets take a look at the distortion as we lower frequency.
Now in general most amplifier distortion measurements are reported at 1kHz. This is more than simple convention. For virtually all audio amplifiers the frequencies around 1kHz are a good indication of the midband performance. By standardizing at this frequency, it becomes easier to compare amplifiers with different bandpass characteristics and have some degree of certainty that the measurements are comparable. Unfortunately, this tells us nothing about the low frequency performance of an amplifier.
To remedy this I took distortion measurements of this amplifier from 1kHz all the way down to 20Hz. This data was taken at 1/2W output power into an 8Ω resistive load. The relative levels of the first three harmonics (2nd, 3rd, and 4th) were recorded and these values used to calculate the effective THD. During testing, higher order harmonics were seldom in evidence, and when visible, small enough to have very little effect on the THD numbers. All four sets of data are plotted below.
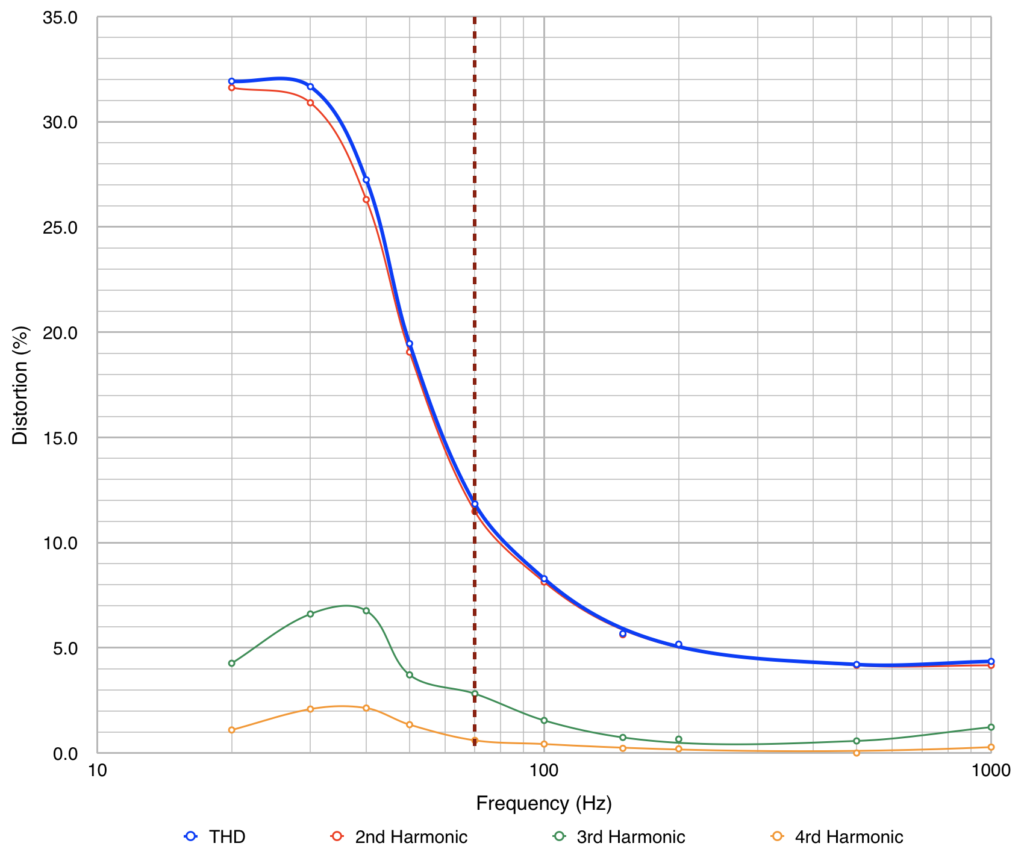
At 1kHz the THD was measured as follows: 5.1% at -1dBW, 4.4% at -3dBW, and 1.0% at -20dBW. The above plots are for the -3dBW output power level. The first thing to note is that as the frequency drops below 200Hz, the THD exceeds the 5% mark rising significantly as frequency decreases. This distortion rises to almost 32% at 20Hz. Surely this can’t be acceptable. Actually, there is a silver lining to this situation.
As the frequency drops, the distortion is mostly 2nd harmonic. This is the first choral harmonic and the primary one used by the human brain for pattern matching and tone recognition. As such, we find high levels of 2nd harmonic distortion pleasant to which to listen. This has to do with the function of the cochlea and the brain. So even pure tones at this frequency, while not accurately reproduced, will still sound pleasant to the ear. In addition, virtually all musical instruments, when producing a note, produce significant levels of 2nd harmonic content. The low frequency reenforcement of these harmonics by the distortion of the output transformer will only serve to reinforce the sound of the music.
This 2nd harmonic distortion, in conjunction with the relative response levels below 70Hz, now helps to explain how an amplifier output transformer only rated to 70Hz, when included in a properly designed amplifier, can produce such a subjectively good sound. The distortion which is introduced at these low frequencies actually enriches the music to our ears.
So the next time someone claims that your output transformer is substandard or even unacceptable, consider the true response of that transformer and the way your brain actually interprets sound. And most importantly trust your ears, they know more about music than every internet blog and expert opinion ever published.