Introduction
So this is the second of my ultra linear bias optimization studies. This one is for the 6L6 power pentode and, like the last one for the 6V6, is done for the 5kΩ plate load case. Since doing the 6V6 assessment almost three years ago, I decided that I needed a more robust way to perform the task. So I built out this simple jig.
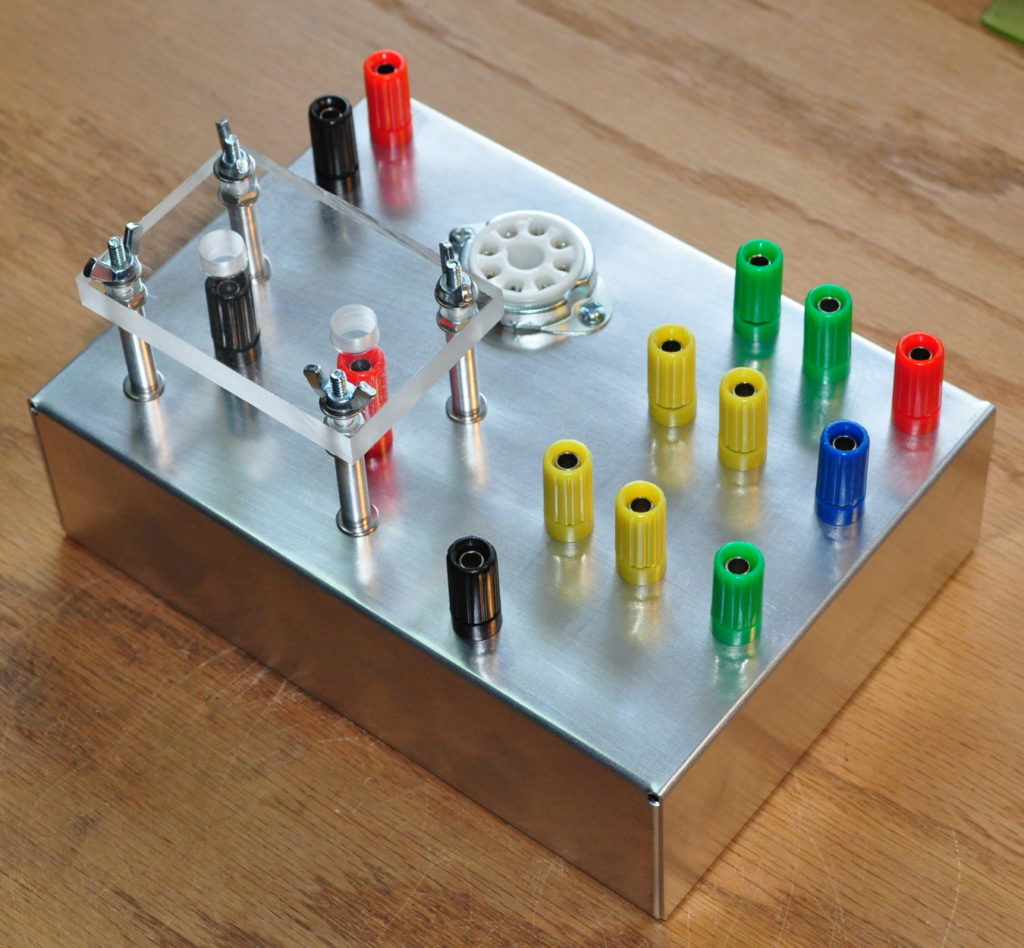
This jig is basically the same, electrically, with the setup I used for the 6V6 investigation. The real difference is that this makes the process simpler and safer. Here is the schematic showing what’s included in the jig.
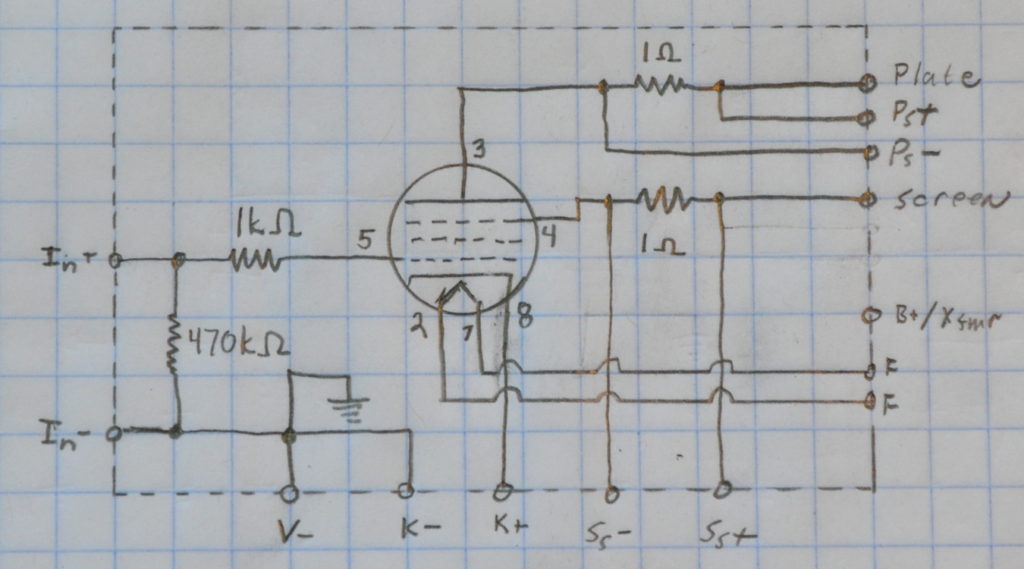
By including the sense resistors and grid input circuit in this jig, I can make the majority of connections with normal test leads. This makes the entire process a lot more robust and less prone to error.
The Setup
For the 6L6, as I indicated above, I decided on a 5kΩ plate load for the UL investigation. Some may question this choice as the commonly used plate load for the 6L6 in SE pentode configuration is between 2.5kΩ and 3.5kΩ. However, I did have a single UL plate characteristics plot from several years back. Working with data and trying out a few configurations led me to believe that the 5kΩ load would be a better fit for the 6L6 in SE-UL configuration.
As before, I wanted to control for constant plate voltages, choose several values based on data sheet information and vary the bias levels at these plate voltages to see how the tube performs. Looking at the various data sheets, I decided on the following five values of plate voltage (i.e. the DC voltage between plate and cathode pins): 250v, 275v, 300v, 325v, and 350v. At each plate voltage I varied the bias voltage and collected data on power out (in the 8Ω load), harmonic distortion, plate and screen dissipation, and current levels. All data was taken at 1kHz. For this study I used an Edcor GXSE 10-5K transformer. Edcor lists the max current on this transformer as 80mA. I definitely pushed this on some of the data points but I didn’t ever see any major signs of core saturation. All the same I would make sure that whatever transformer you choose is rated for the current required.
At this point I should make a comment about my test setup; specifically my power supply. My main power supply on my bench is a rebuilt HeathKit IP-17 HV power supply. This supply has two main limitations. First is that it only goes to 400vdc. This means that I couldn’t go to 375v Vp unless I wanted to use fixed bias. Since I had decided to stick with cathode bias, just like the 6V6 study, means that I had to limit myself to 350v Vp. The second limitation is that this supply only supplies a maximum of 100mA. This means that I had to limit the lower bias voltage conditions, due to available current. All the same, there was still sufficient capacity to check out a good range of operation on the 6L6.
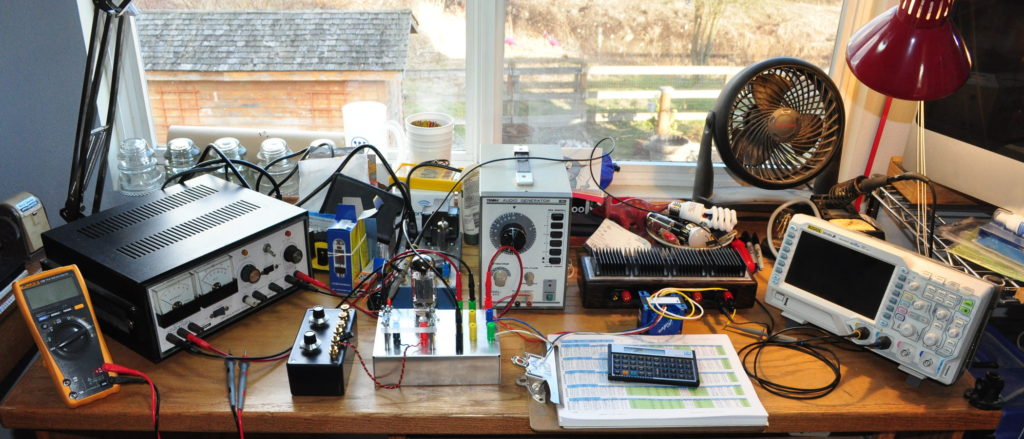
Here is the test setup just after I finished taking all the data.
The Data
I took the data the same way as before. I set the B+ for a given plate voltage, adjusted for a bias voltage that resulted in a combined current which was close to the limit of the IP-17, and then walked up the bias voltage until the falloff in performance was getting pronounced. At no point did I run into any kind of excessive distortion. I should also mention that I also never saw any 4th or higher order harmonic distortion. This is a distinct and striking difference from the 6V6 tube data.
The first piece of data, and the one in which most people are probably most interested, is the RMS power output verses the bias voltage. This data is shown below.
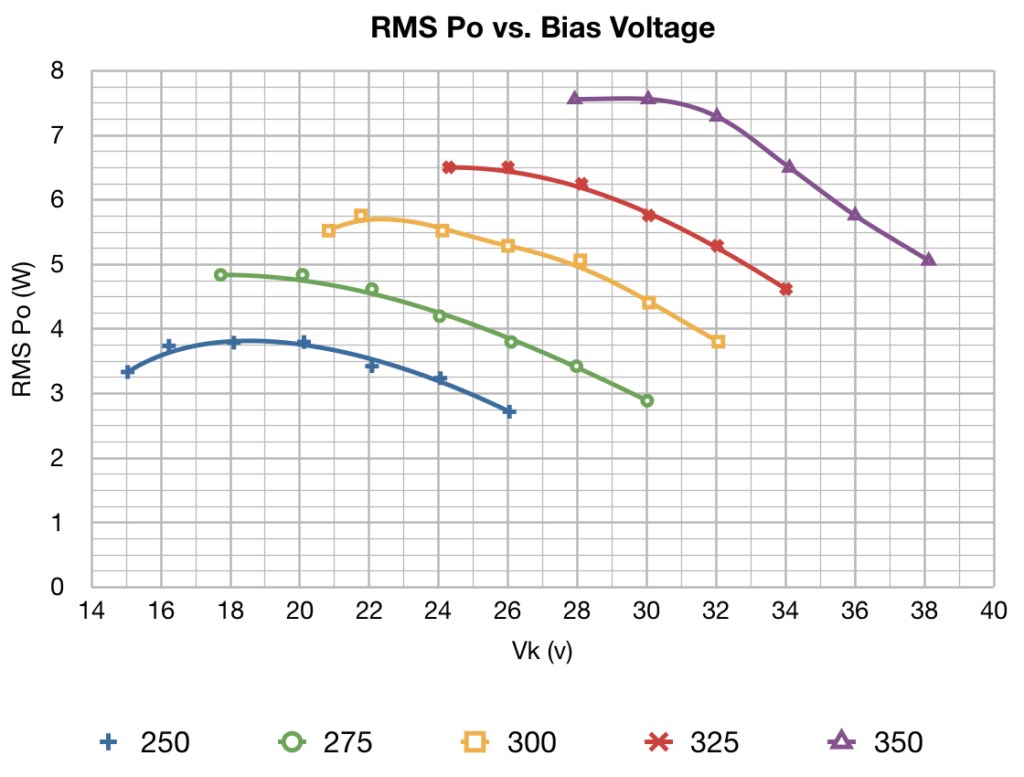
This data set shows how the maximum RMS output power delivered to the load (as measured at the actual load resistor) varies with bias voltage at each of the chosen plate voltages. Because plate current increases as the bias voltage is reduced, the maximum plate dissipations are represented by the left most points on each curve. As before, the plate voltage seems to be the major driver in maximum power output. Variation in bias voltage at a given plate voltage really doesn’t have a great effect on peak RMS power output. The maximum variation being less than 1.5dB except for the very highest bias voltage point on each of the 275v, 300v, and 350v curves. Also, as before, there appears to be a bias voltage “sweet spot” on each of the plate voltage curves with respect to the power out.
The next piece of data, which is of as much importance as the power curves above, is the distortion data. The following plot shows the total harmonic distortion in percent, verses bias voltage, at each of the chosen plate voltages.
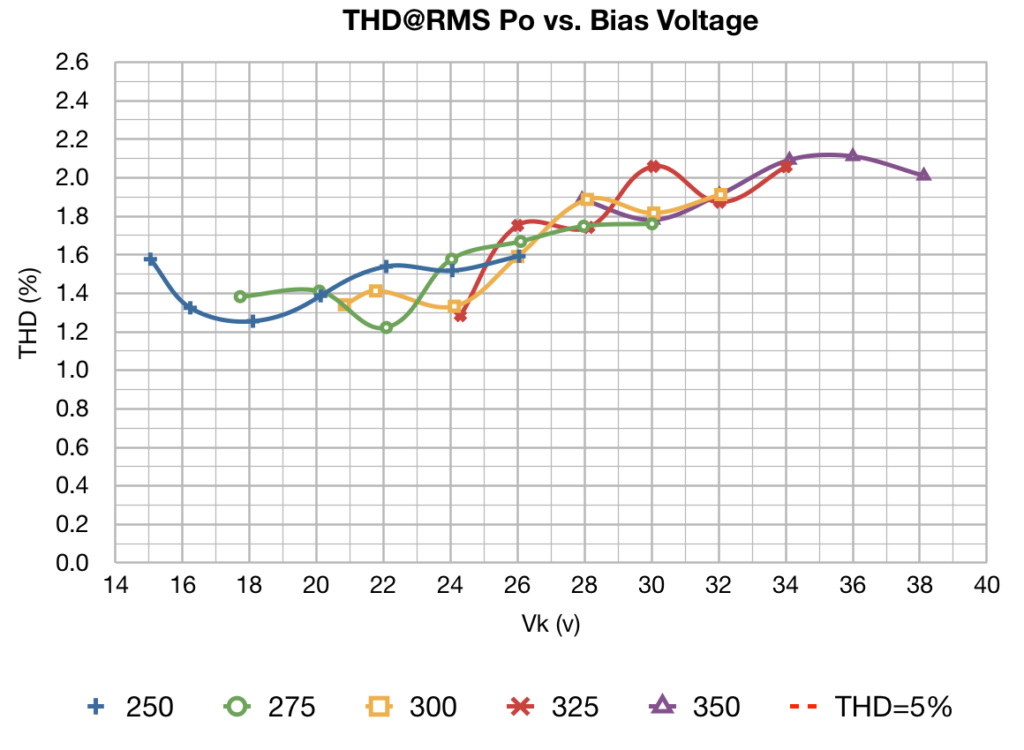
The first thing to notice here is that the distortion does not seem to vary by plate voltage. Unlike the 6V6 which showed distinct distortion variations by plate voltage, the 6L6 seems to not exhibit such a dependancy. However, in this plot you can see that the distortion does seem to show a slow increase with bias voltage. This got me to wondering about the overall signal chain distortion, so I decided to see if I could isolate the driver distortion and then estimate only the residual power stage distortion.
Now, for a driver in this setup, I just grabbed a 4S preamp with a JJ ECC83S (12AX7) preamp tube. This was never intended to be a driver circuit outputting large voltages, so I thought the distortion measurements should tell me something interesting. So here is the measured distortion of just the signal generator and the 4S driving the grid resistor in the test jig.
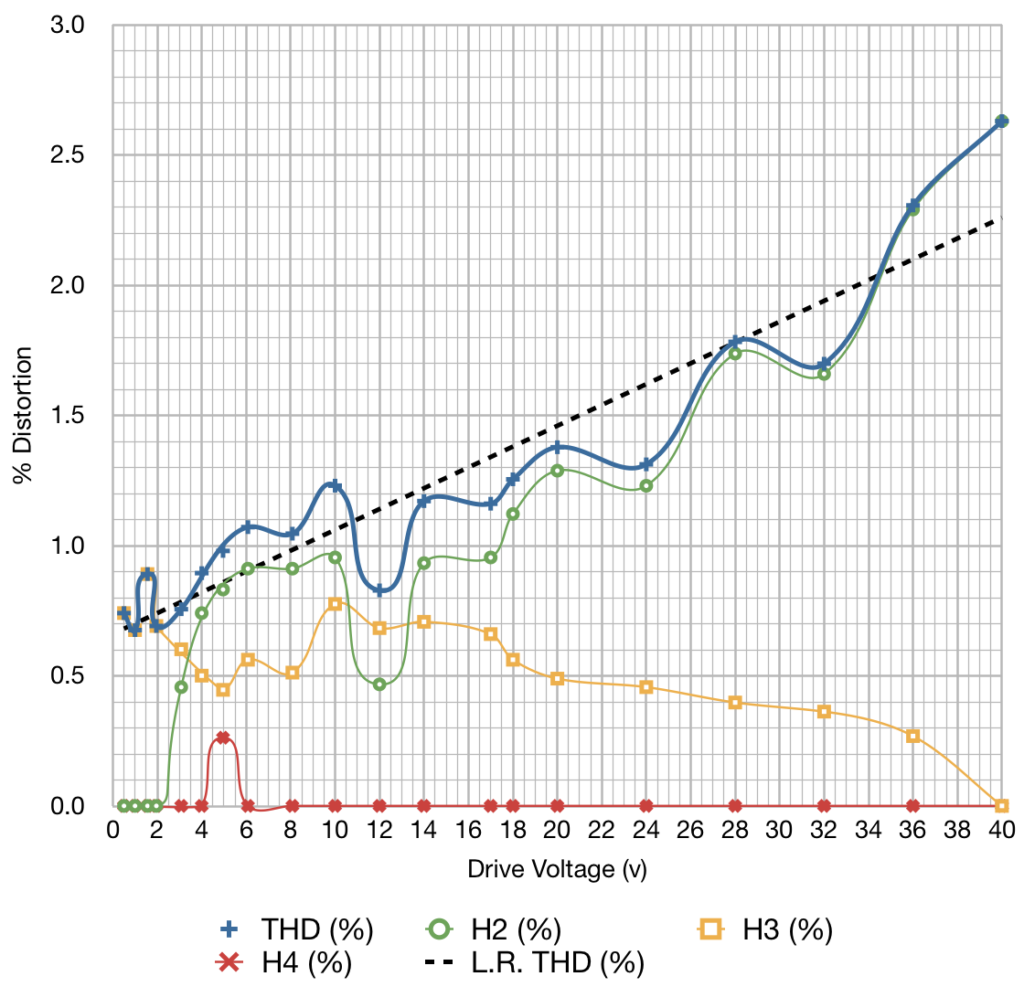
On this plot you can also see a linear regression fit to the driver distortion as a function of drive voltage. This could easily be the reason for the increasing distortion in the THD plot above. So I decided to back out the best fit curve of driver THD from the total measured THD to see what the residual distortion looks like. After removing the driver distortion, this is what was left for the residual power stage THD.
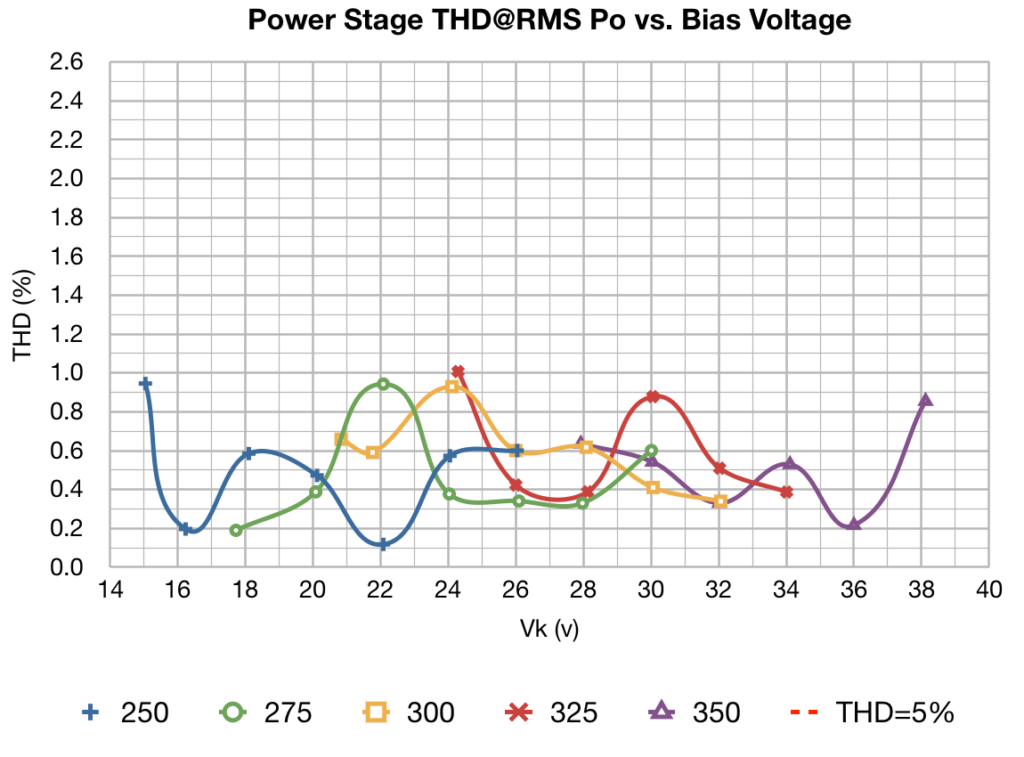
As can be seen in the plot, all the distortion numbers are below 1% at peak power out with an average of around 1/2%. So the takeaway message on distortion is that the choice of optimization points really doesn’t depend on distortion. Regardless of the points chosen, the design should produce a nice clean output. In light of this, the optimization points will instead be chosen based on other factors like output power, plate and screen power dissipations, and required current draws.
Since distortion is not going to be a driving factor in the optimization, the next items to be examined are the plate and screen power dissipations. Here are the plots from the raw data.
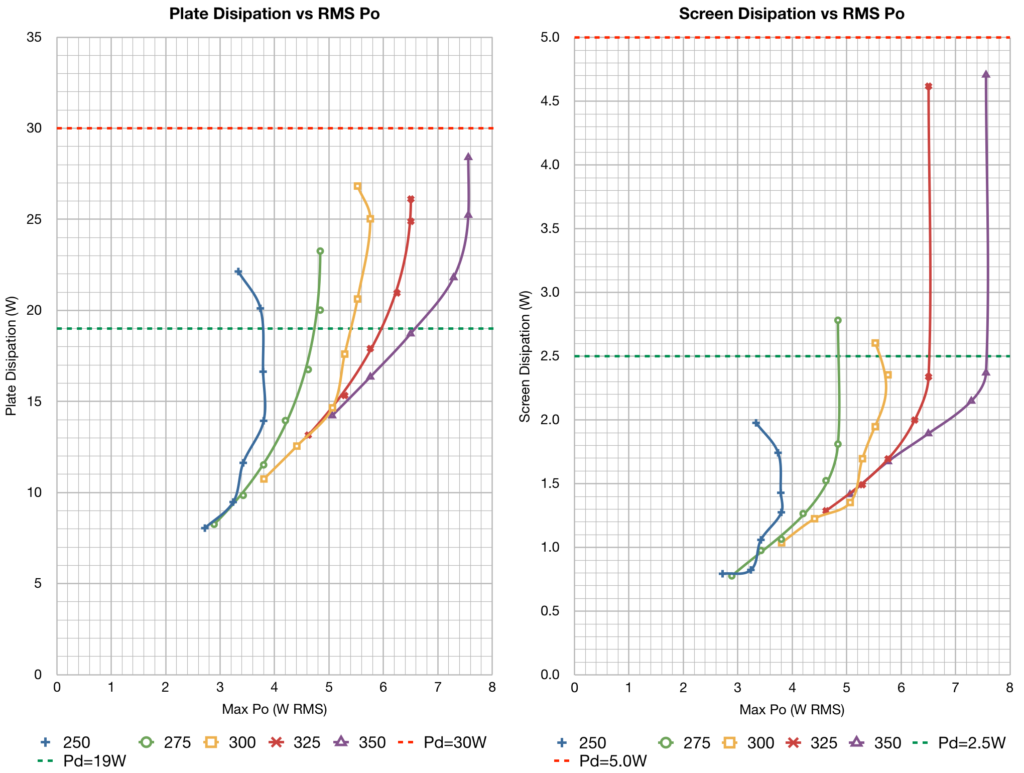
Since the discussion has shifted to power, these plots show plate and screen dissipations as a function of maximum power out instead of Vk. This allows the direct comparison of “power wasted” vs “power produced” to determine where the approximate points of diminishing returns occur. I’ve also included the maximum power indications for the older 6L6/6L6G/6L6GB (19W plate and 2.5W screen) and the newer 6L6GC (30W plate and 5W screen). Of course there is also the 5881 (not shown) which is between the two (23W plate and 3W screen). In these plots, along each Vp contour, the maximum Vk vales are at the bottom with Vk decreasing as element dissipation increases
The first thing to notice in this data is that for each plate voltage curve, there is clearly a point of diminished returns where increasing Vk further produces no more or even decreases output power. In addition, at the higher plate voltages, it is clear that there is a very nonlinear relationship where the screen begins to dissipate significantly more power. This is likely due to the beam plate controlling field reaching its design limits and increasing electron flux from the cathode impinging on the screen grid. Clearly, these points should be avoided in operation.
The other point of interest concerning dissipation is thatat no time, with the exception of the very lowest values of bias voltage, did any of the configurations have a screen dissipation in excess of 2.5w. This low screen dissipation power seems to be a basic characteristic of UL operation. As such, screen resistors should not be required except in very special circumstances.
The other data set of interest is the plate and screen current vs power curves. This data is important for power supply design and if you are using smaller output transformers which may have a saturation current limitation. Here is what the data looks like.
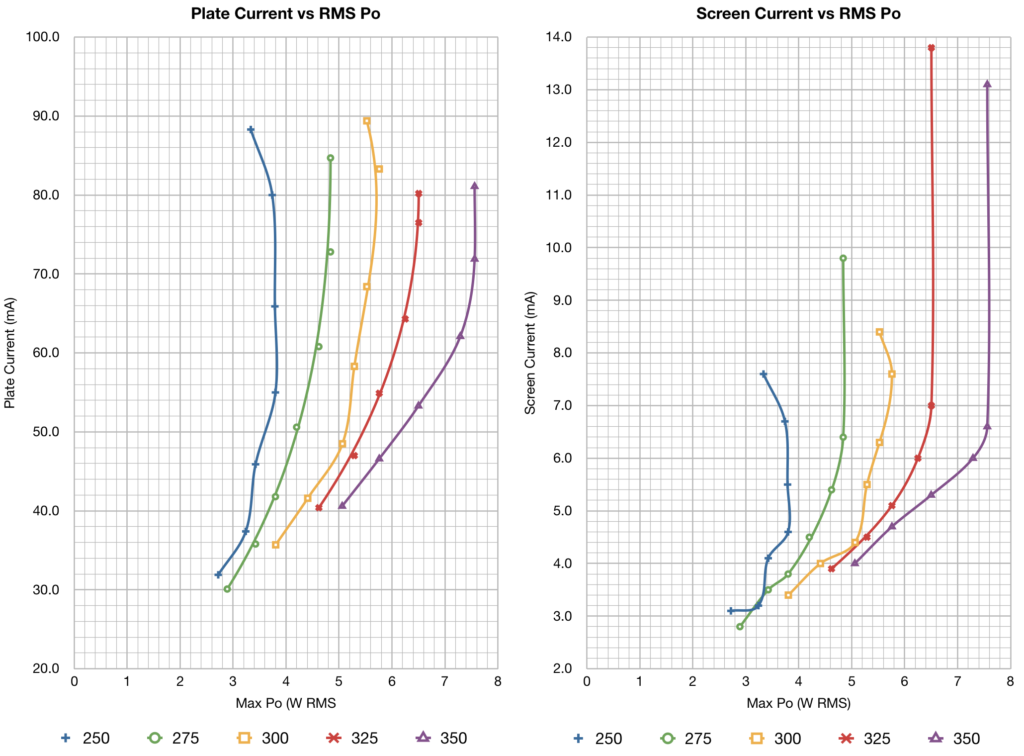
These curves are very similar to the power curves above. In these curves, the breakdown of screen function is evident as it was above. Additionally, it appears to be manifested at the lowest Vk point on the Vp=275v curve as well. These are operation points should clearly be avoided if possible.
The Optimization
So the only thing remaining is to put all this data to good use to arrive at some points of optimization. Unlike the 6V6 SE-UL optimization, where I endeavored to achieve a balance between distortion and power, for the 6L6 the distortion values are mostly irrelevant being as small as they are. As such, I have sought to select points from the data set which represent near maximum capability (i.e. maximum power out) at each plate voltage, while avoiding those points showing abnormal screen operation.
In the optimization data that follows I have chosen from each plate voltage series, a single bias point which I believe reflects the best tradeoff between achieving peak power out and maintaining good tube performance at that plate voltage. These individual points are then folded into a single data set which represents a set of optimized conditions for the 6L6 operated in a cathode biased ultra linear configuration with a 5kΩ load transformer.
All parameters are plotted against the tube operational plate voltage Vp. Please note that this is not B+ voltage but the actual plate to cathode voltage. This distinction allows this data to be used for a fixed bias configuration as well, with the understanding that the distortions my not be quite as good. I present the data in three different pieces. The first, is a plot of the optimum bias voltage (Vk) verses the plate voltage. This plot shows how the bias voltage should be changed as plate voltage is changed.
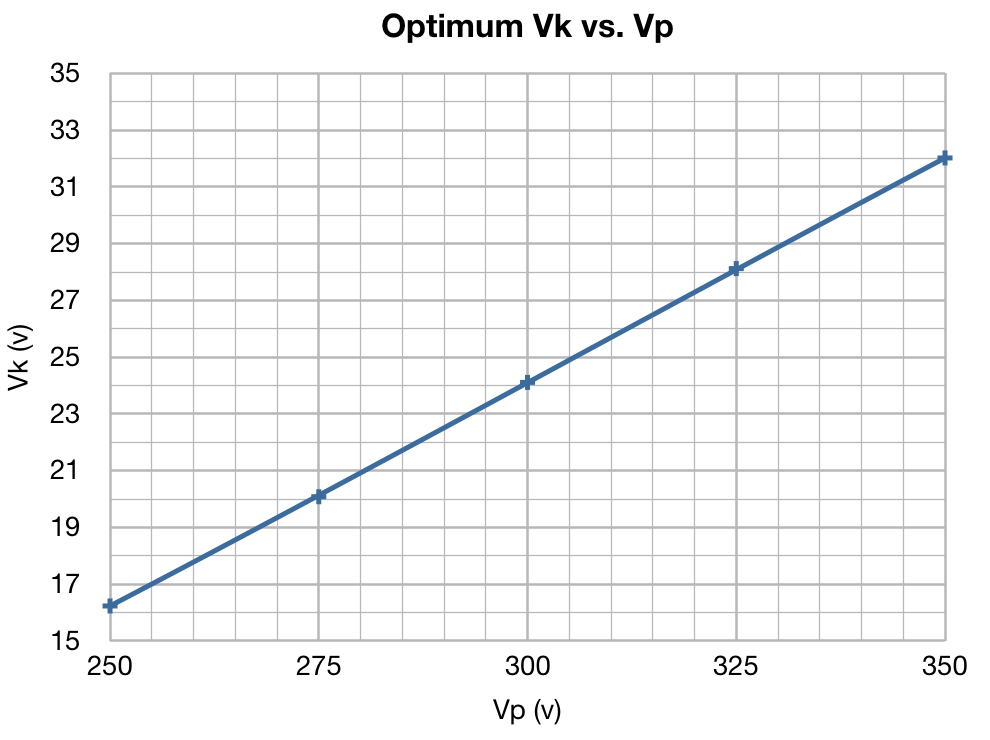
This plot shows that the progression of Vk as Vp increases is fairly linear. I believe this to be a good result because it shows that the optimization point of the tube changes proportionally to circuit voltages. This implies that these optimized operating points really are related to the inherent structure of the tube and not to some chance circuit configuration. The other important thing to note is that the optimized bias voltages are significantly greater than those generally published for pentode operation. For example Vp=300v and Vk=-12.5v for pentode operation from the GE 6L6-GC March 1959 data sheet verses Vp=300v and Vk=24v for UL operation above.
The next set of plots show how the circuit behaves at these bias points. These plots show peak RMS power output at each point, the plate current, and the screen current levels. Here are the plots.
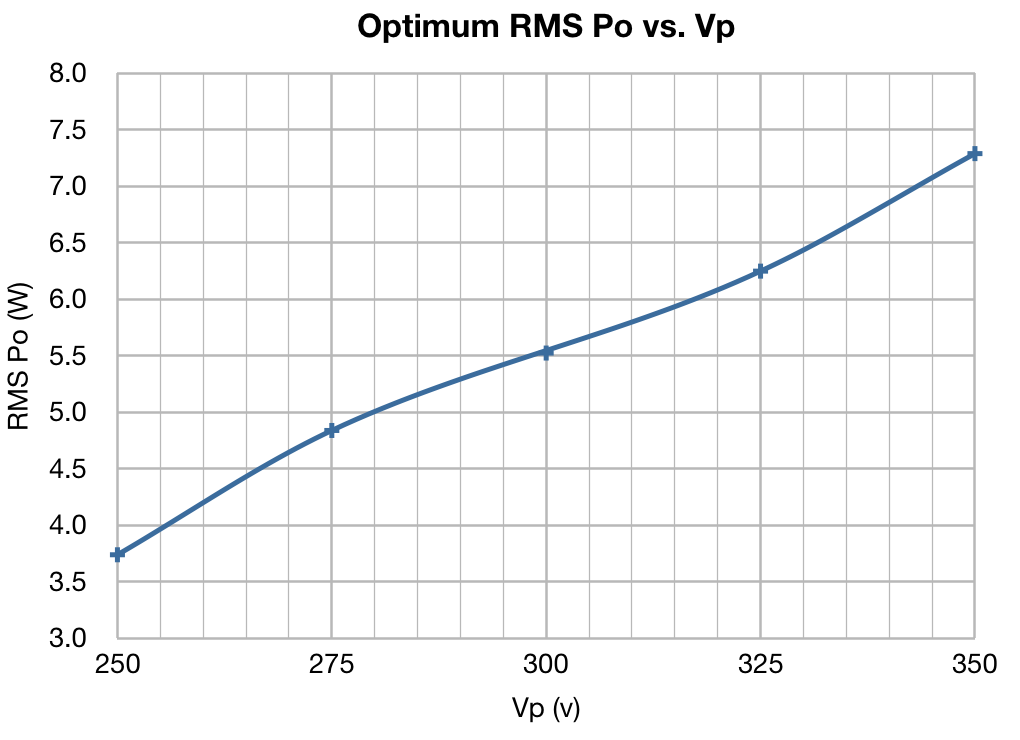
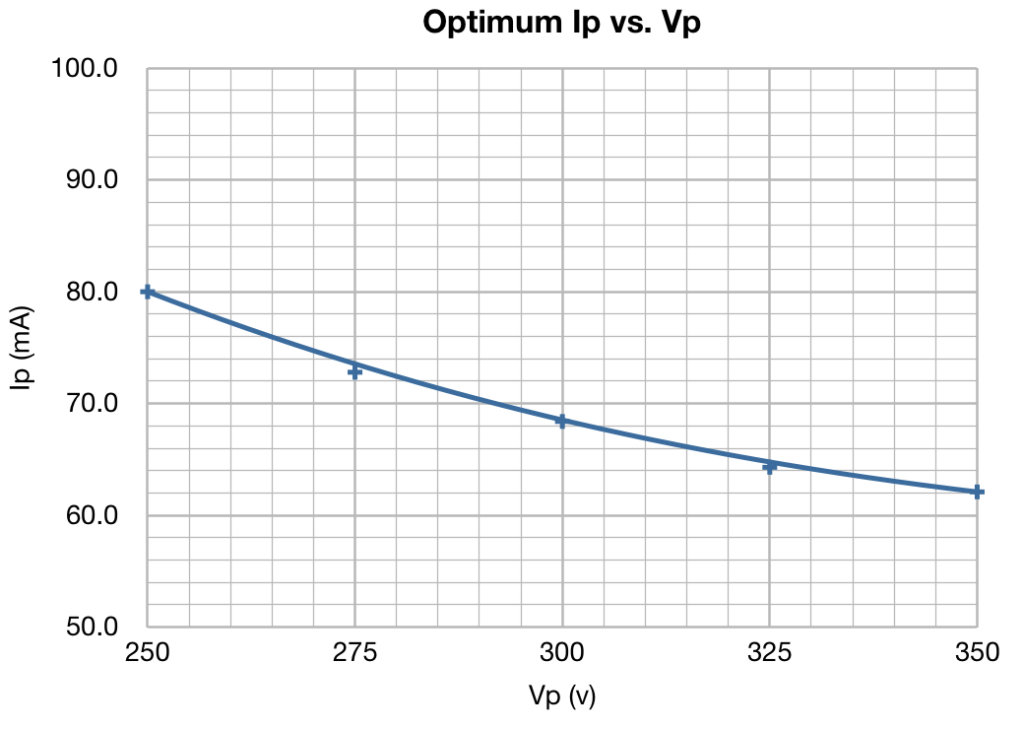
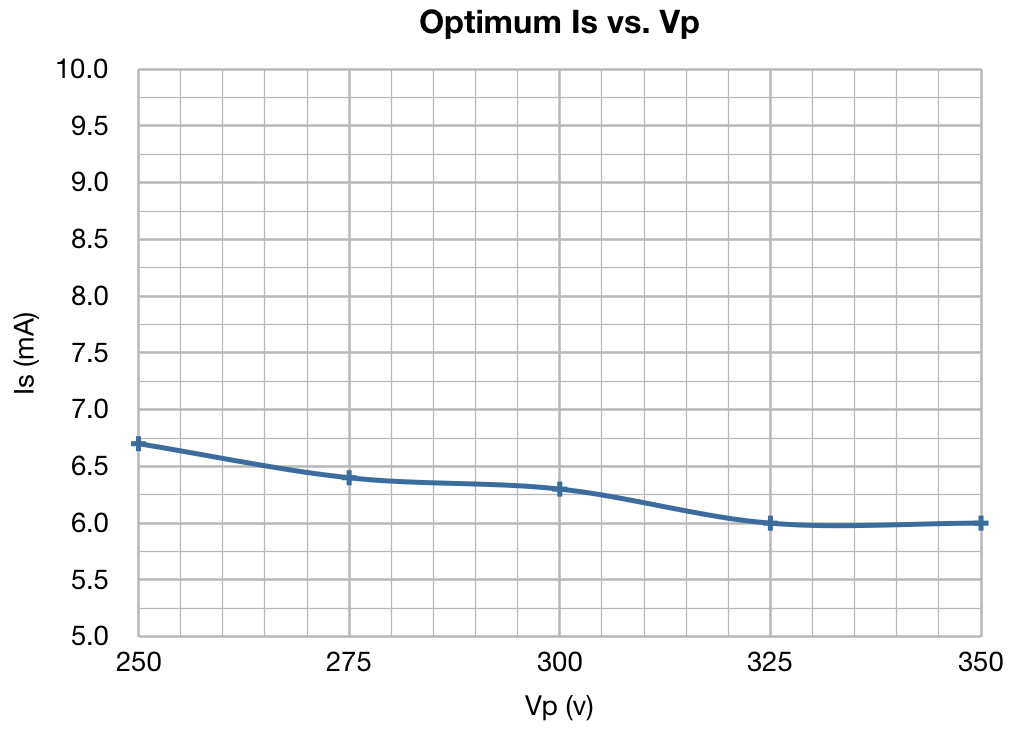
These results again illustrate the relatively linear relationships between optimized operating points and tube voltages (and current) noted above.
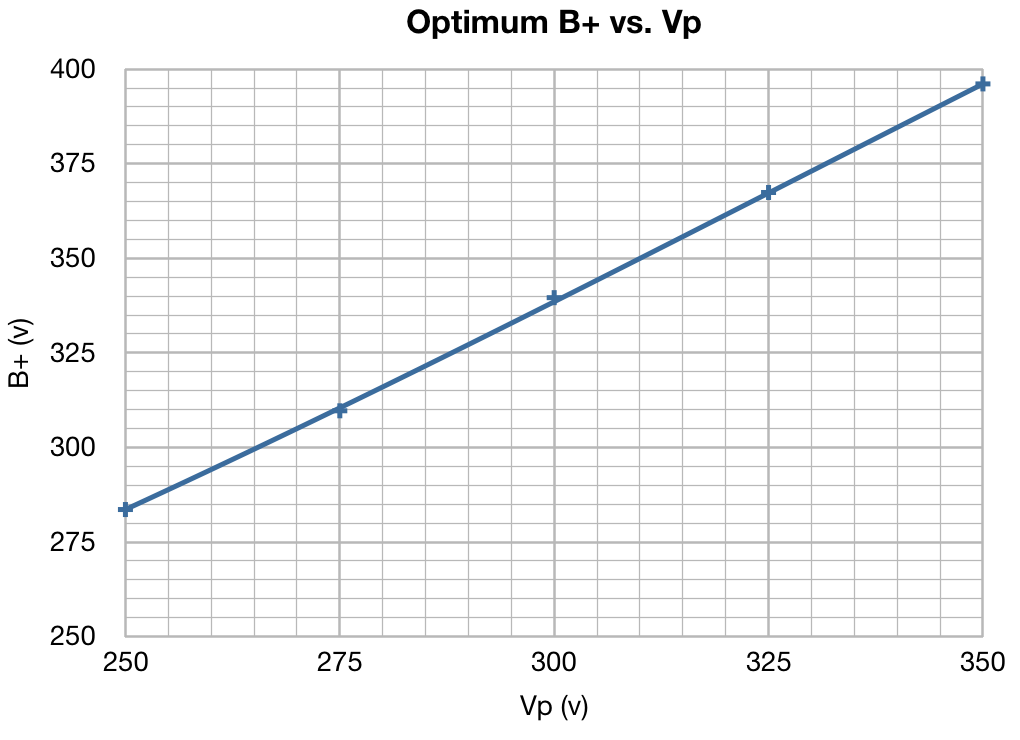
The final two plots concern the choice of circuit parameters to achieve these operational conditions. The first is a plot of the B+ voltages used to achieve these circuit conditions. As each bias was dialed in, the B+ was adjusted to ensure that the plate voltage was maintained very closely. In all cases the B+ voltages at each plate voltage were very nearly constant; within about 1.8v for all bias voltages investigated. And the second plot shows the all important cathode resistor value at each optimized bias point.
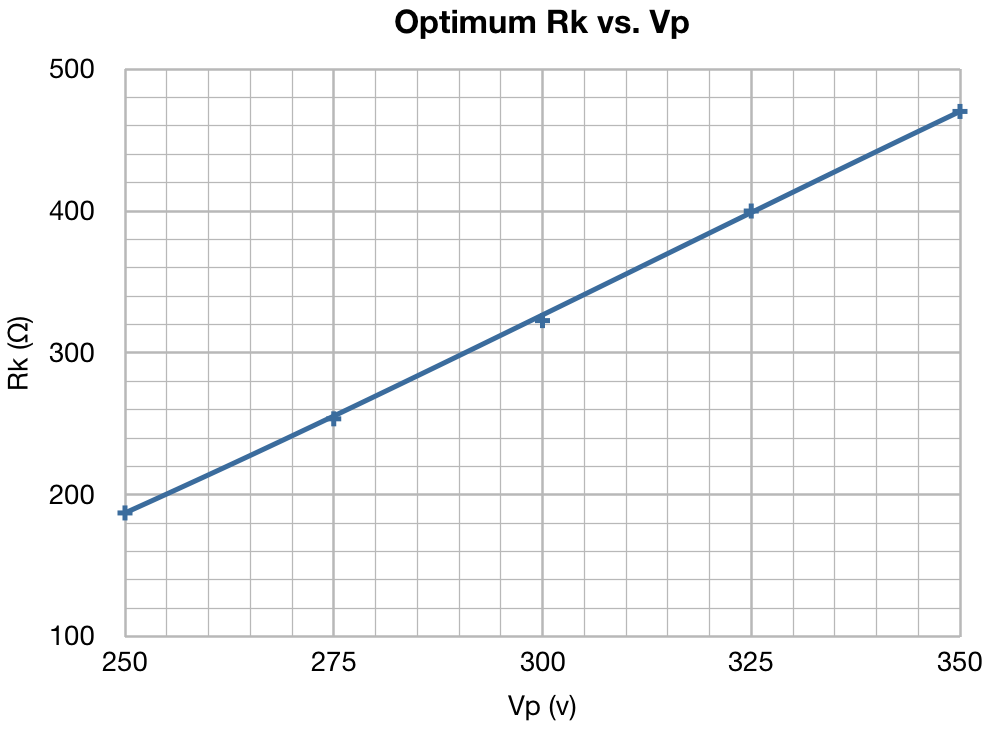
It is very interesting to note that value of Rk for optimized operation varies significantly verses Vp. The variation here is from 187Ω to 470Ω; the value more than doubling. In the case of the 6V6 this variation was only 9%.
And finally here is the data I used to plot the optimized operating curves. I have included some more data here than I did in the 6V6 optimization report, which may be of interest.

This data should be suitable for all 6L6GC and 5881 tubes. Please note that these operating points are not suitable for the older 6L6/6L6G/6L6GB tubes. The plate dissipation here is too high for these older tubes.
Conclusion
So this data set turned out to be somewhat different from the first set for the 6V6. First, I learned that the 6L6 can be very low distortion in the SE-UL configuration, which was a pleasant surprise. Secondly, I realized that it can produce some reasonable power levels to satisfy those with a desire for such. And I now have a complete set of data on how to bias and operate the 6L6 in the SU UL configuration (at least at one load impedance) for my future builds.
Like the 6V6 optimization before, I consider this a successful endeavor. As I start my next design I won’t have to just use pentode bias points and hope for the best. I’ll be able to consult the data I collected and intelligently chose an operating point that meets my design goals and works well with the rest of my design. My hope is that others will also find this information helpful as they start their own 6L6 SE UL builds.